MAINE CENTRAL
H. H. Copeland & Son: Freight Traffic Data & Maps
Introduction
H. H. Copeland & Son was a New York based investment services firm who compiled and distributed freight traffic data for railroads to better inform their clients. These records are held only in a few known repositories today: Harvard University's Baker Library, Northwestern University's Transportation Library, the Library of Congress, and in the Barriger collection at St. Louis's Mercantile Library. The resources below were acquired from the first two locations.
New resources were offered each year, or in some isolated cases, a document covered two years. It does not appear that any one location has a 'complete' set of resources; there seems to be a lot of overlap, but each has some unique items. There is no consistency on railroad coverage. Not all locations have finding aids, so the full scope available has not yet been determined.
The data available come in the following forms:
Freight Traffic Density by Divisions and Direction: this is a map (and listed as such below,) of each railroad broken into segments, with Net Ton Miles of Revenue and Company Freight depicted for each direction along a segment;
Freight Traffic Density: the data used to generate the map above offered in a tabular format;
Freight Traffic Distribution: a chart depicting density (net ton miles) and percentage of total ton miles related to percentage of total mileage;
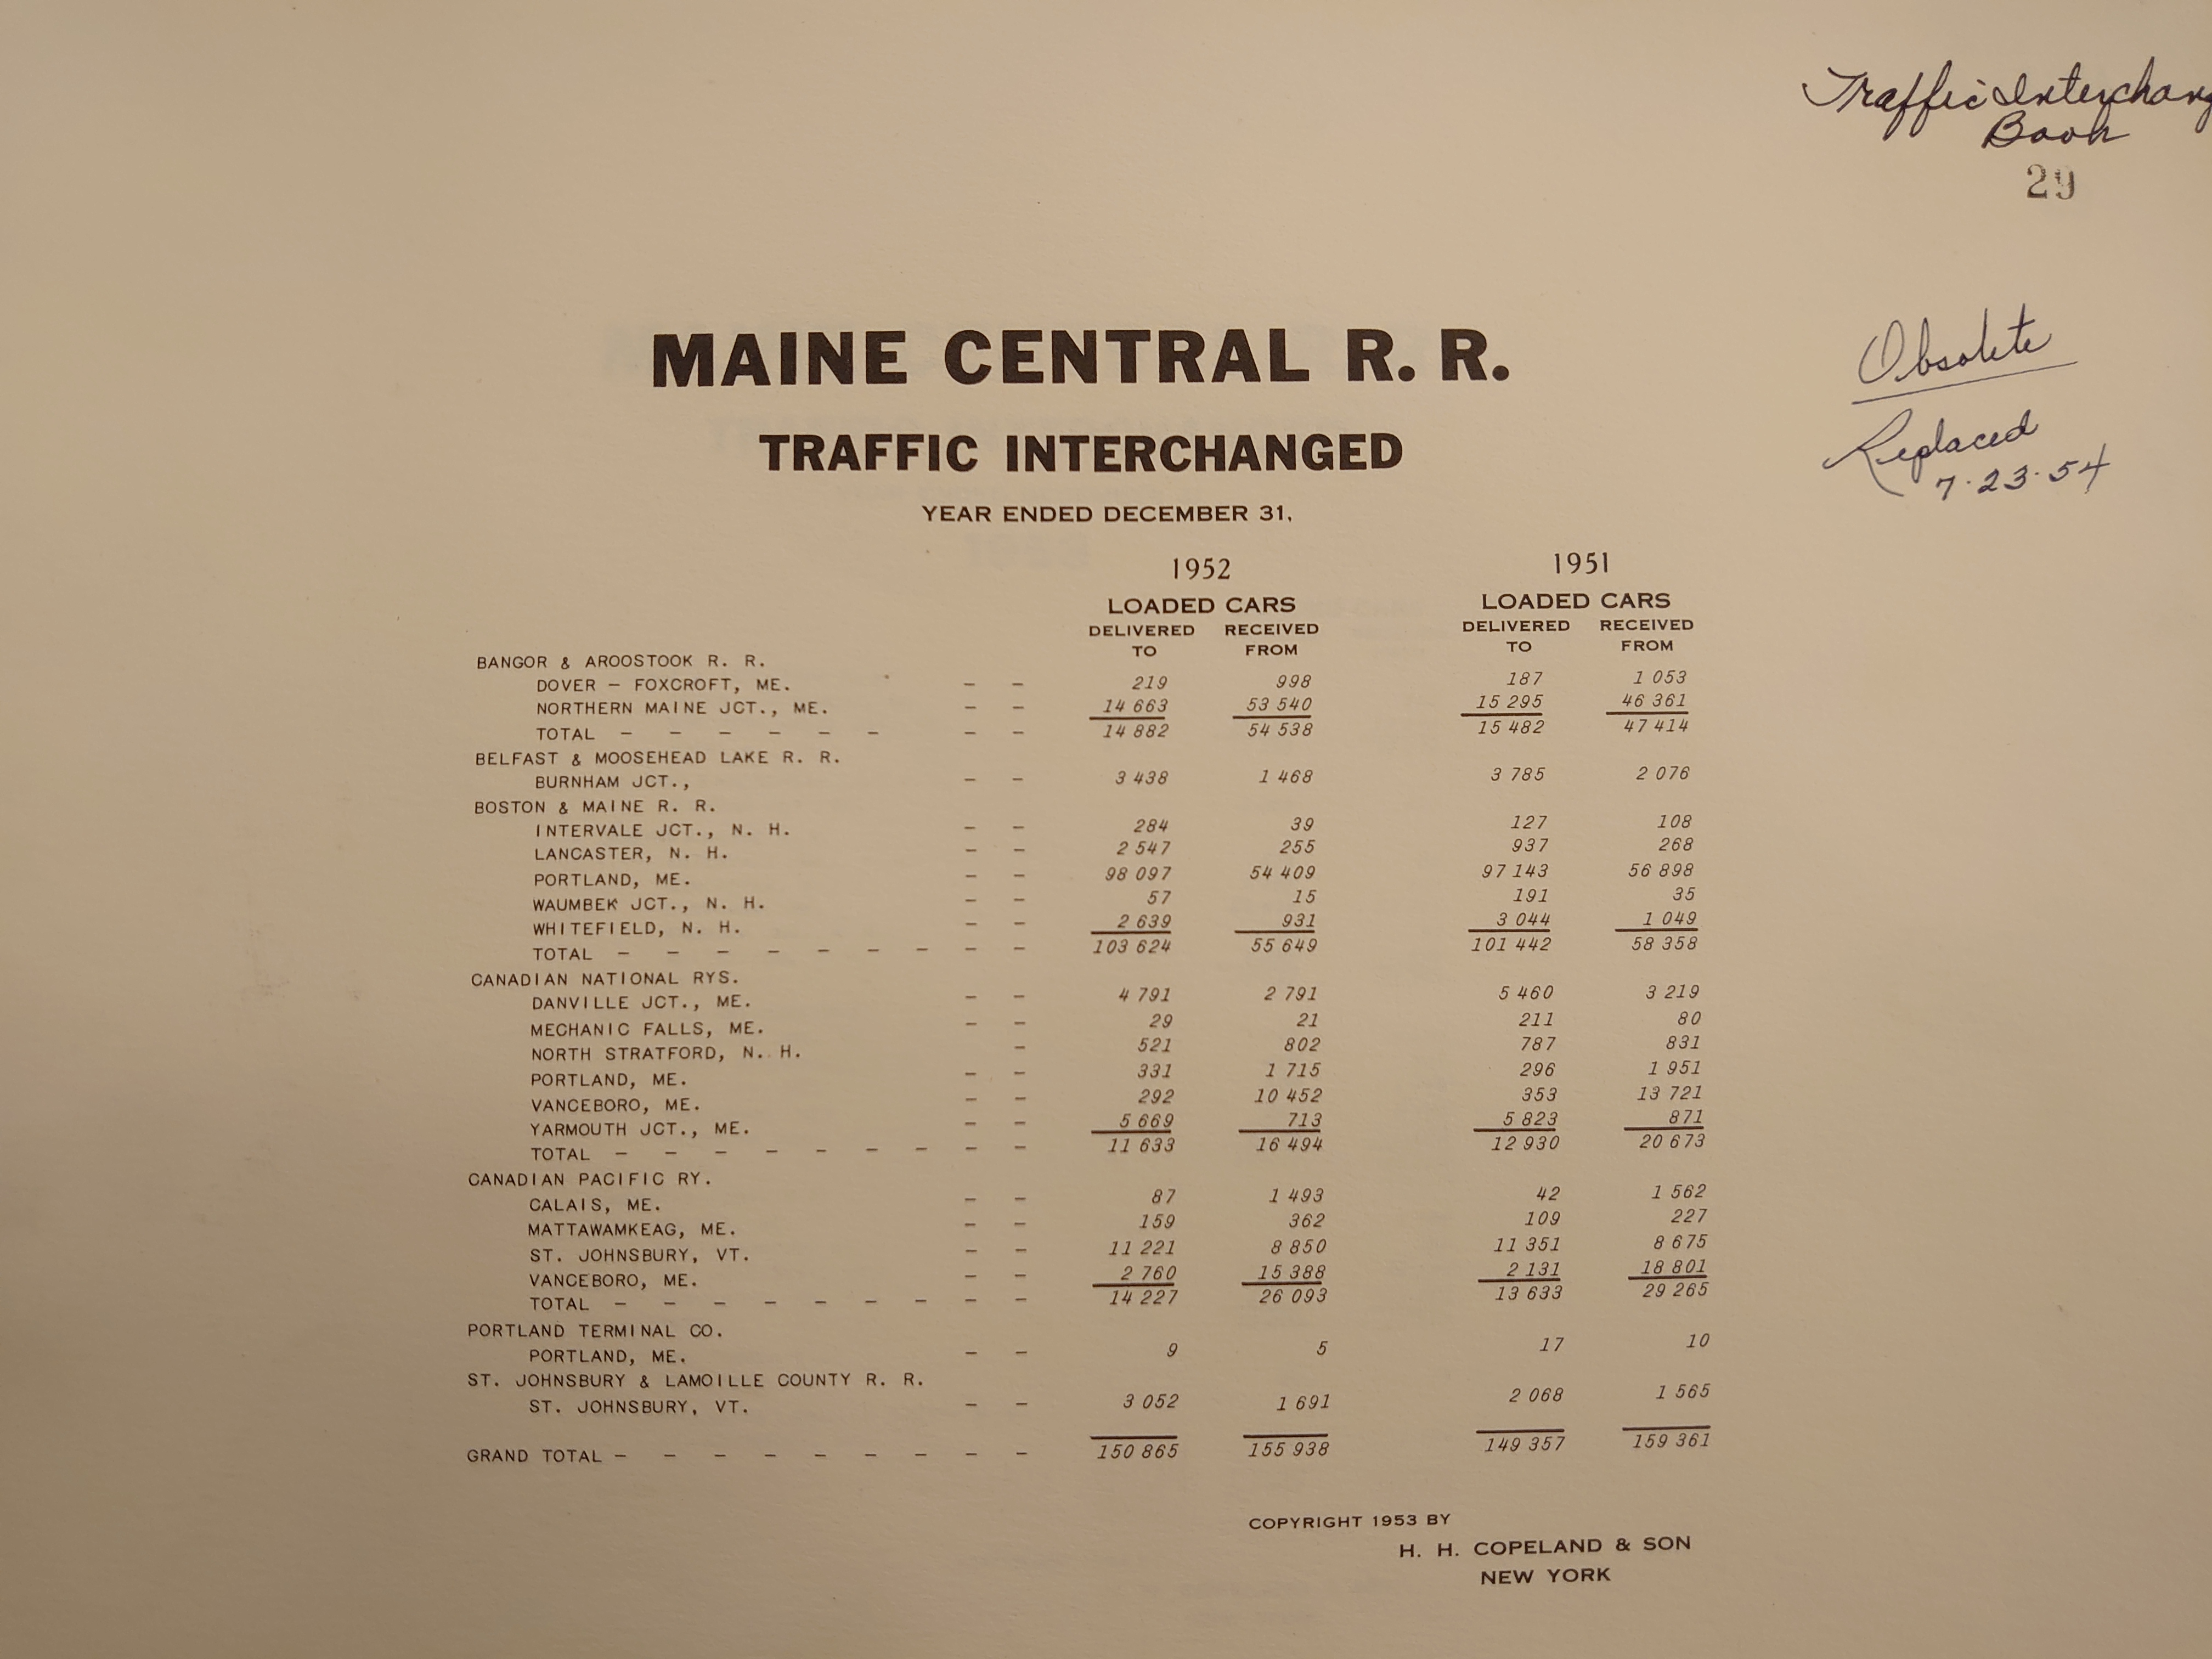
Traffic Interchanged: tabular data of loaded cars delivered to and received from each interchange point;
Statistics: Density and net ton miles per dollar outstanding debt for individual companies operated: mortgaged, owned, leased.
MEC Data
It is common that libraries discourage large format scanning for visitors, but encourage documenting their collections with cell phone cameras, overhead scanners, etc, which do not make contact with nor flatten the documents. Consequently, the images below may have string weights, fingers, keystoning, and/or blurry edges. File size runs from 1.2 to 4.7 MB each.
| Year | Map | Density | Distribution | Interchange | Statistics |
|---|---|---|---|---|---|
| 1919 | No | At LOC | No | No | No |
| 1925-6 | No | No | No | Yes (25-26) | No |
|
1930 1931 |
Yes Yes |
Yes (30-31) | No | Yes (30-31) | No |
|
1934 1935 |
No Yes |
No Yes |
No |
Yes (34-35) Yes |
No |
|
1936 1937 |
Yes Yes |
Yes (36-37) | No |
Yes Yes |
No |
| 1938 | Yes | Yes | No | Yes | No |
| 1939 | Yes | Yes | No | Yes | No |
| 1940 | Yes | Yes | Yes | Yes | No |
| 1941 | Yes | Yes | No | Yes | No |
| 1942 | No | No | No | Yes | No |
| 1943 | No | No | No | Yes | No |
| 1944 | Yes | Yes | No | Yes | Yes |
| 1945 | Yes | Yes | No | Yes | No |
| 1946 | No | No | No | Yes | No |
| 1947 | No | No | No | Yes | No |
| 1948 | No | No | No | No | No |
| 1949 | No | No | No | Yes | No |
| 1950 | No | No | No | Yes | No |
|
1951 1952 |
No | No | No | Yes (51-52) | No |
| 1953 | No | No | No | Yes | No |
| 1954 | No | No | No | Yes | No |
| 1955 | No | No | No | Yes | No |
| 1956 | No | No | No | Yes | No |
Note: for the 1935 map and density table, versions for Year Ending June 1935 and Year Ending Dec 1935 are available. Other years are consistently Dec. I have only offered the Dec 1935 version, but if you wish to have the June version, I can supply it.
Posted 3/29/25. Updated 3/30/25. Maintained by Earl Tuson